


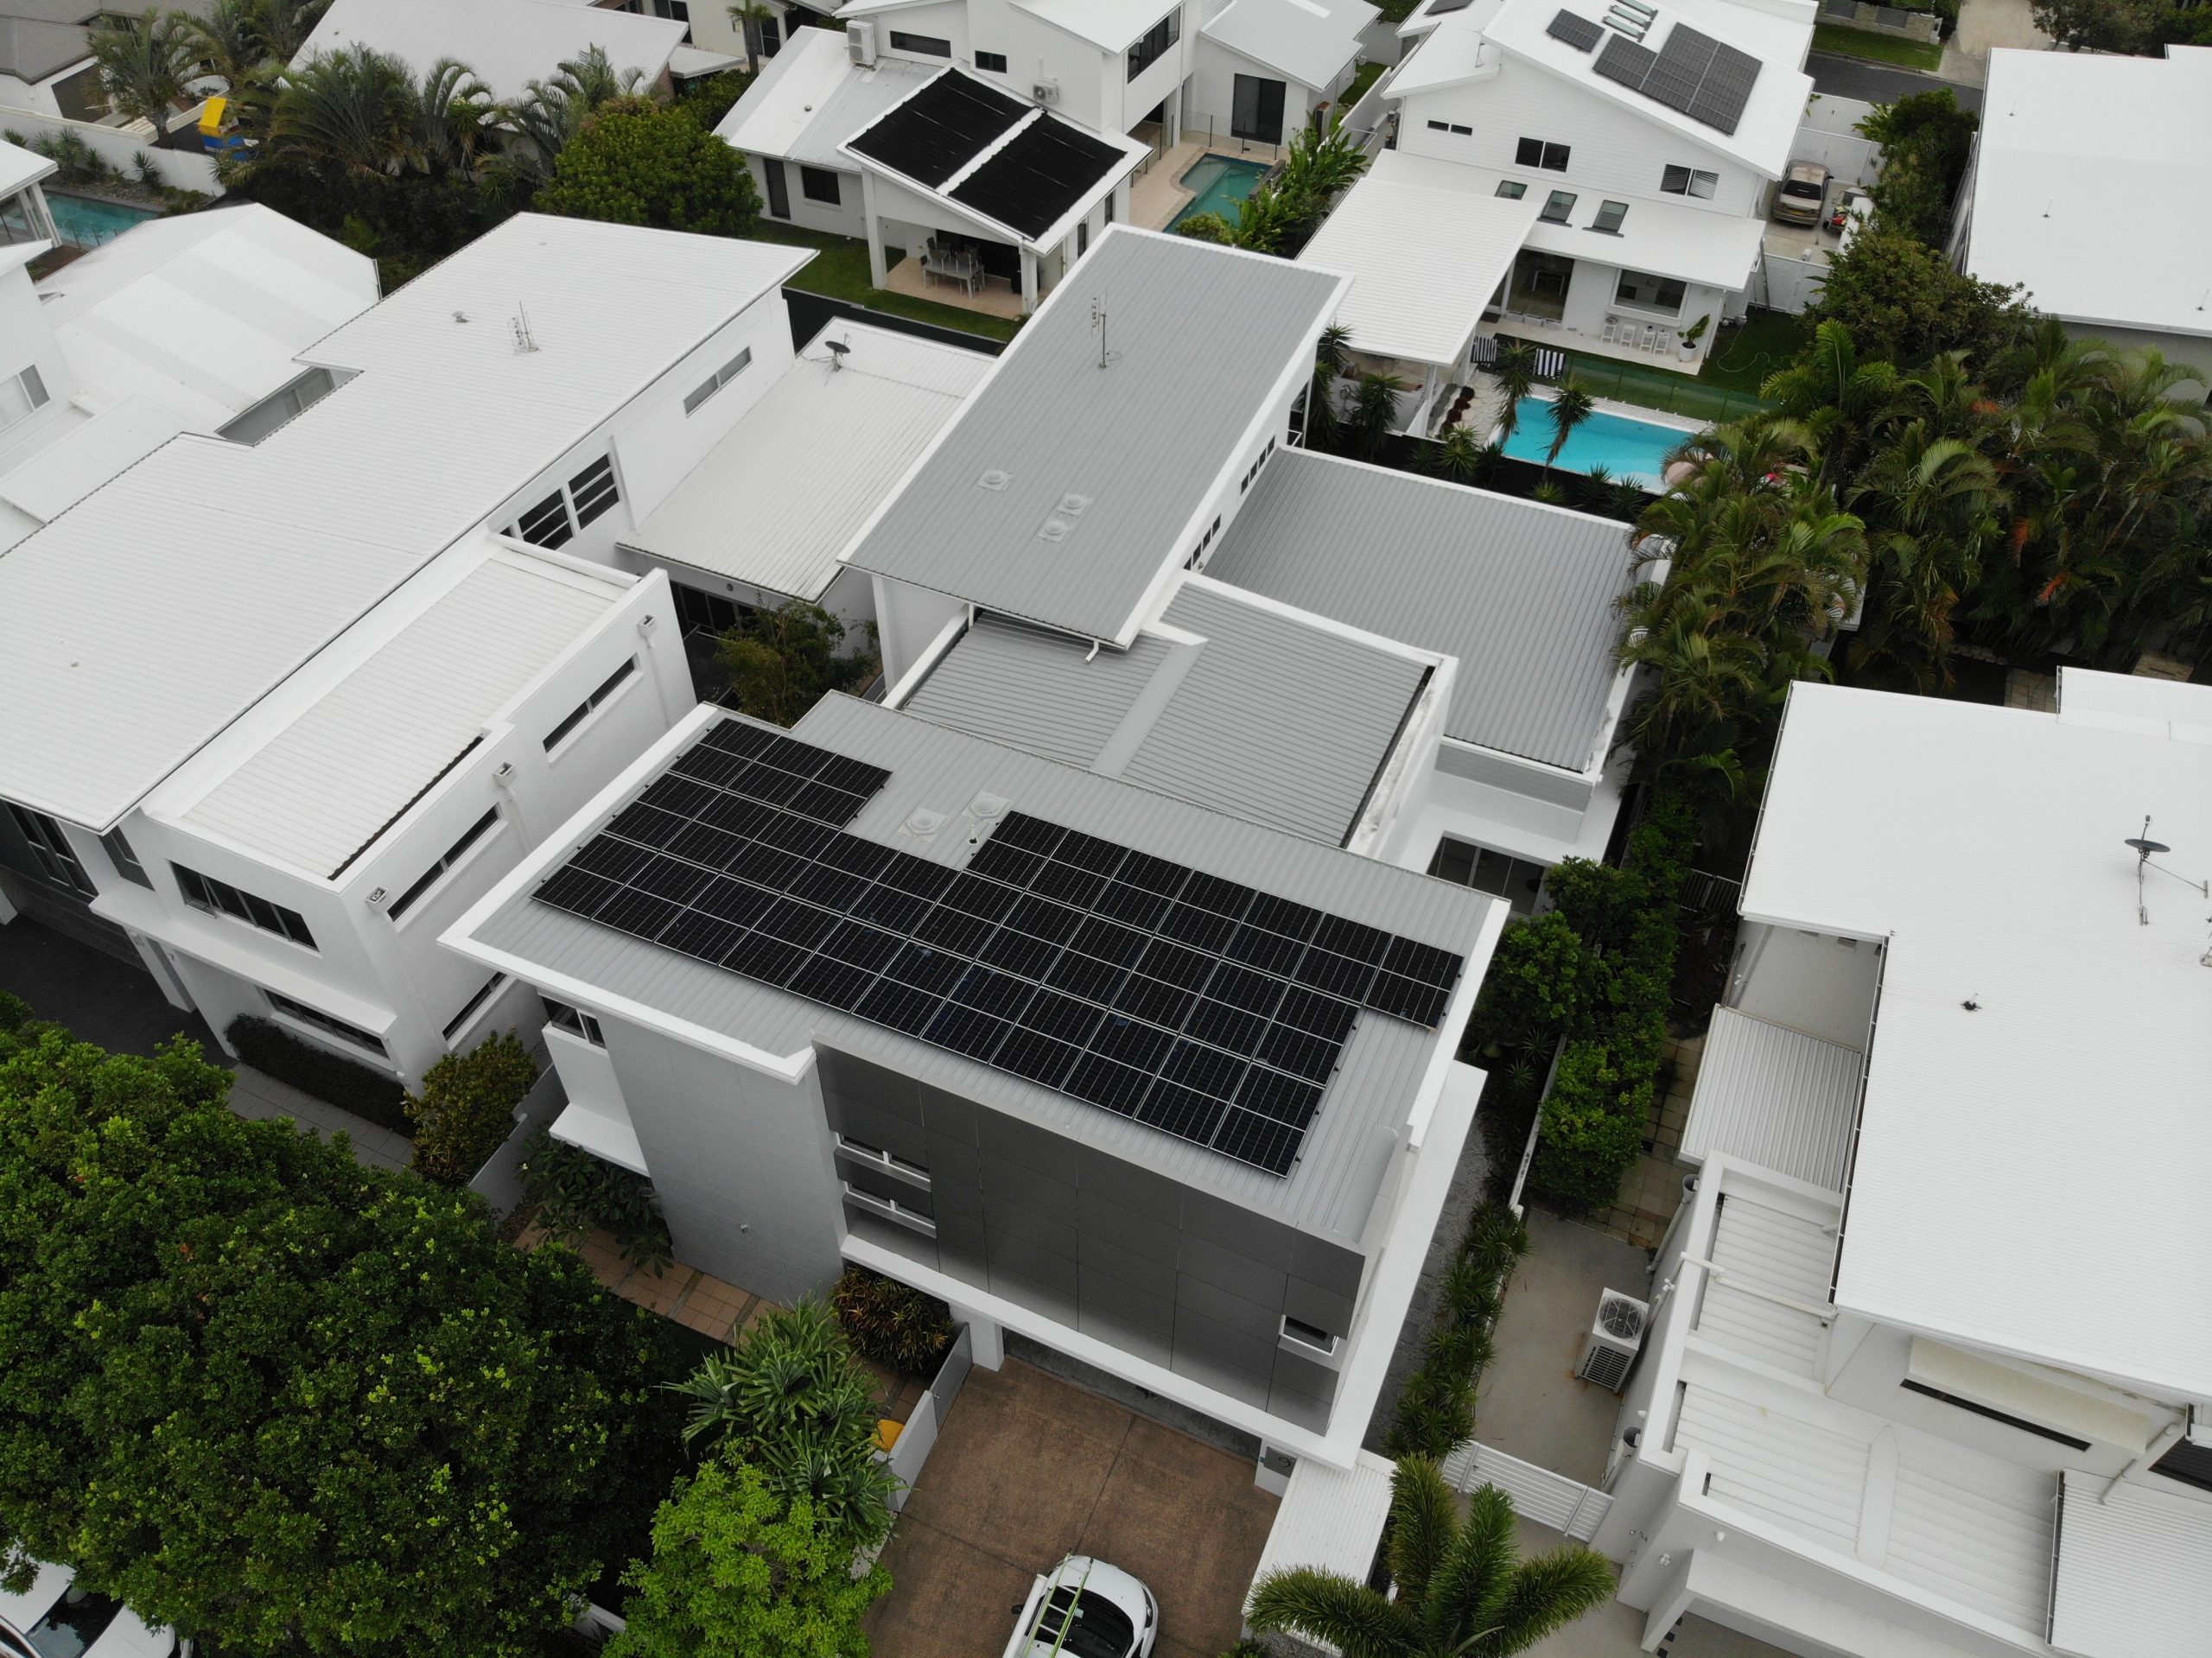

How much solar can save on your Queensland power bill comes down to three numbers every solar savings calculator needs. They are the share of your solar you use at home, the feed-in tariff you earn on the rest, and how many kWh each kW of panels makes a day. Solar Set designs and installs home solar across the Gold Coast, Brisbane and Northern NSW, and we work from those same three numbers.
Your yearly saving is roughly the solar you use at home multiplied by the usage rate on your own bill. Add the solar you export multiplied by your feed-in rate, and you have the estimate any calculator is trying to give you.
This guide works through an example dated October 2026 with every assumption on show. We will not promise you a saving or a payback figure, because nobody can do that honestly without your bill and your roof.
Updated October 2026. An earlier version of this page used an outdated 2024-25 feed-in tariff of 12.377c for South East Queensland.
Key Points
- The Queensland Government’s solar-for-rentals calculator assumes each kW of solar generates 4.2kWh a day and a South East Queensland feed-in tariff of 2.4c/kWh.
- Regional Queensland has a feed-in tariff of 6.006c from 1 July 2026, while South East Queensland retailers set their own rates.
- In SolarDecision’s Brisbane worked example, using 45 per cent of the solar at home gave about $1,474 a year, against about $1,032 a year at 25 per cent.
- The ACCC found the median NEM household with rooftop solar paid about 18 per cent less than the grid-only median of $1,565 in 2023-24, and solar plus a battery paid about 40 per cent less.
- Dynamic export connections allow up to 10kW per phase, against 5kW on a basic connection, which matters for larger systems.
What does a calculator need, and how do you size from your bill?
A good calculator asks for your daily use in kWh, not just your bill total. That figure is printed on your quarterly bill, and it does more for accuracy than any other input.
To turn it into a rough system size, divide your daily use by 4.2, the kWh per kW per day the Queensland Government calculator assumes. A home using 24 to 30kWh a day lands around 6.6kW, which matches what we quote for that size on our residential page.
Treat that answer as an upper limit, not a target. Most homes cannot use all their solar in the middle of the day. The extra kW mostly export at a low feed-in rate unless you shift loads or add a battery.
- Your postcode tells the calculator whether you are in South East Queensland, regional Queensland or Northern NSW, which changes the rates it should apply.
- Your time at home decides how much solar you use as it is generated, because an empty house during daylight sends most of its solar to the grid.
- Your tariff and feed-in rate should come from your own bill, since a calculator’s default rates may be out of date or set for a different region.
- Your roof’s direction, pitch and shade change how much each kW of panels produces, which is why we assess your actual roof.
A calculator also cannot see your switchboard. Our guide to whether you need a switchboard upgrade for solar explains the four checks that decide it.
What does a worked QLD example look like?
The clearest public assumptions come from the Queensland Government’s solar-for-rentals calculator, which publishes the rates it uses. It was built for landlords and tenants and describes its results as illustrative, so treat it as a starting point rather than a quote.
Its self-consumption assumption drops from 30 per cent to 21 per cent as the system grows to 10kW. A bigger system makes more power at midday than most homes can use, so more of it is exported at the low feed-in rate.
SolarDecision’s worked Brisbane solar example shows why self-consumption matters most. Using 45 per cent of the solar at home gives about $1,474 a year, while 25 per cent gives about $1,032 a year, on an editable 5c feed-in rate rather than a South East Queensland average.
That is why moving your dishwasher, pool pump or hot water into daylight hours can lift your result without adding a single panel.
| Assumption | Figure used |
|---|---|
| South East QLD feed-in tariff | 2.4c/kWh |
| Regional QLD feed-in tariff | 6.006c/kWh |
| Generation per kW of solar | 4.2kWh a day |
| Self-consumption, 3kW to 7kW systems | 30 per cent |
| Self-consumption, 10kW systems | 21 per cent |
| General supply tariff | Use the rate on your own bill |
Why do two calculators give different answers?
Two calculators disagree because they assume different rates, different self-consumption and different output. A small change in any one of them moves the result a long way.
The seasons are another big gap. Your panels make more on long summer days and less in winter, while air conditioning can lift your summer use. An estimate broken into seasonal bills is more useful than one annual average.
The ACCC’s advice on solar and battery quotes is to compare several quotes, ask for personalised savings information and not rush.
- The feed-in tariff is the biggest trap, because South East Queensland retailers set their own rates while regional Queensland has a rate of 6.006c from 1 July 2026.
- A tool that assumes you use most of your solar at home will give a far rosier answer than one that assumes 30 per cent.
- A single flat tariff ignores time-of-use plans, where the rate your solar replaces changes through the day.
- Export limits cap what a large system can send to the grid. Dynamic export connections allow up to 10kW per phase, against 5kW on a basic connection, and the limit is set by your network.
How do time-of-use plans and the Solar Sharer window change the numbers?
Time-of-use plans charge different rates at different times of day, so your solar is worth whatever rate it replaces in that hour. Check the peak, shoulder and off-peak rates on your own bill, because a calculator using one flat rate cannot show this.
The Solar Sharer offer adds a free-power window in the middle of the day. Check its hours and whether your retailer offers it in your area before you build it into an estimate.
A free midday window lowers the value of solar used in those hours, because you would only be replacing free grid power. Your solar then earns its keep in the morning and late afternoon, and a battery can carry it into the evening peak. You get the most from your plan when your heavy loads run while power is cheapest.
When does solar not pay off, and does a battery change that?
Solar is a harder case when your house is empty all day and you are on a low feed-in rate. At the Government calculator’s 2.4c/kWh South East Queensland feed-in assumption, exported solar earns a small fraction of the usage rate on your bill.
It also struggles when your use is low and mostly after dark, your roof is heavily shaded, you still hold an older, higher feed-in tariff, or you plan to move soon.
A battery stores daytime solar for the evening, which lifts self-consumption. The ACCC’s 2023-24 data in the table below shows the gap, though these are national medians, not Queensland figures, and they are more than a year old.
| Household type | Median annual bill | Compared with grid-only |
|---|---|---|
| Grid-only | $1,565 | Baseline |
| Rooftop solar | $1,279 | About 18 per cent less |
| Solar plus battery | $936 | About 40 per cent less |
| Virtual power plant household | $580 | About 63 per cent less |
The Cheaper Home Batteries Program, a federal discount on eligible batteries, has stepped down every six months since 1 May 2026, so check the current figure on our solar battery rebates page. When the numbers work, we size the battery to your evening load, as with this 19.8kW solar and 25kWh battery system in Hollywell.
What changes for Gold Coast, Brisbane and Northern NSW homes and businesses?
Gold Coast and Brisbane homes sit on the Energex network in South East Queensland, so retailer feed-in offers apply rather than the regional rate. Northern NSW homes sit on the Essential Energy network, so use the rates on your own NSW bill.
Small-scale Technology Certificates (STCs) are a federal discount taken off the price at the point of sale, and the discount on the same system shrinks each year to 2030. STCs only apply when the system is installed by an installer accredited by Solar Accreditation Australia (SAA). Our Gold Coast solar panel cost guide covers what that means for price, and current prices sit on our solar and battery packages page.
Homes near the water, like those we service for solar in Burleigh Heads, need coastal-rated, marine-grade rails and stainless fixings so the system lasts. Across the border, we have installed home systems in Kingscliff from a 14kW solar and battery system to a 15.5kW system with a 20kWh battery on a short-term rental.
Businesses need an on-site assessment, because household calculators cannot handle commercial tariffs, demand charges or daytime trading loads. Our solar design and engineering team designs around how your site uses power. From a 39.9kW system with a 60kWh battery at BYD Burleigh to a 40.2kW system with a 25kWh battery at Brisbane Truck School, each system starts with the site’s own bills.
With a local crew, your estimate reflects your network, your rates, your roof and your coastline.
Frequently Asked Questions
Is solar worth it in Queensland if I’m at work all day?
It can be, but the numbers are weaker. An empty house during daylight exports most of its solar, and the Queensland Government calculator assumes just 2.4c/kWh for exports in South East Queensland. Moving your dishwasher, pool pump or hot water into daylight hours helps.
What feed-in tariff should I use for the Gold Coast?
Use the feed-in rate on your own retailer bill. Gold Coast homes are on the Energex network in South East Queensland, where retailers set their own rates, so the regional 6.006c rate from 1 July 2026 does not apply.
How do I work out what size solar system I need from my bill?
Divide the daily kWh on your bill by 4.2 to get a rough upper size. A home using 24 to 30kWh a day lands around 6.6kW, though self-consumption often argues for less unless you shift loads or add a battery.
Does adding a battery increase solar savings?
It usually lifts self-consumption, but it depends on when you use power. The ACCC found the median NEM household with solar plus a battery paid about 40 per cent less than grid-only households in 2023-24, against about 18 per cent less with solar alone.
Is a bigger solar system always better for savings?
No, a bigger system is not always better. The Queensland Government calculator assumes self-consumption falls from 30 per cent for 3kW to 7kW systems to 21 per cent at 10kW, so more of a large system’s output is exported at the low feed-in rate.
Get a solar estimate built on your own bill
Book a free assessment and Solar Set will work from your actual bill, your roof and your network, not a generic calculator. You get a system design and a straight answer on what it will and will not do for your bill. Call 1300 330 923 or see our residential solar page.
